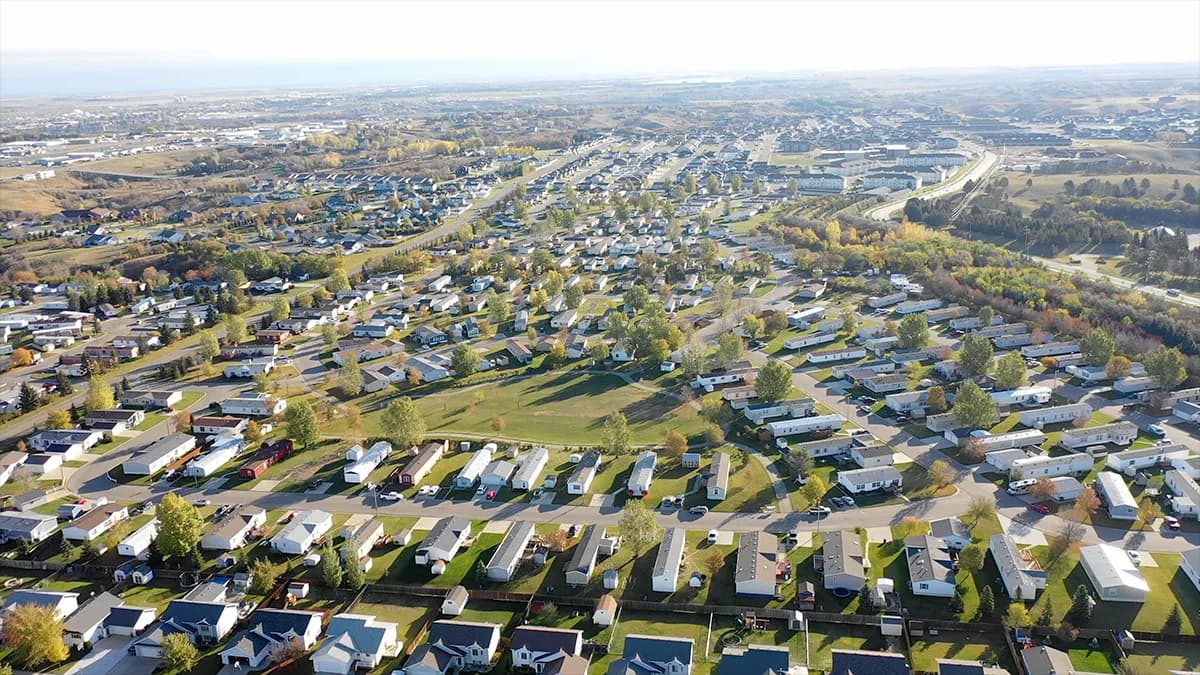
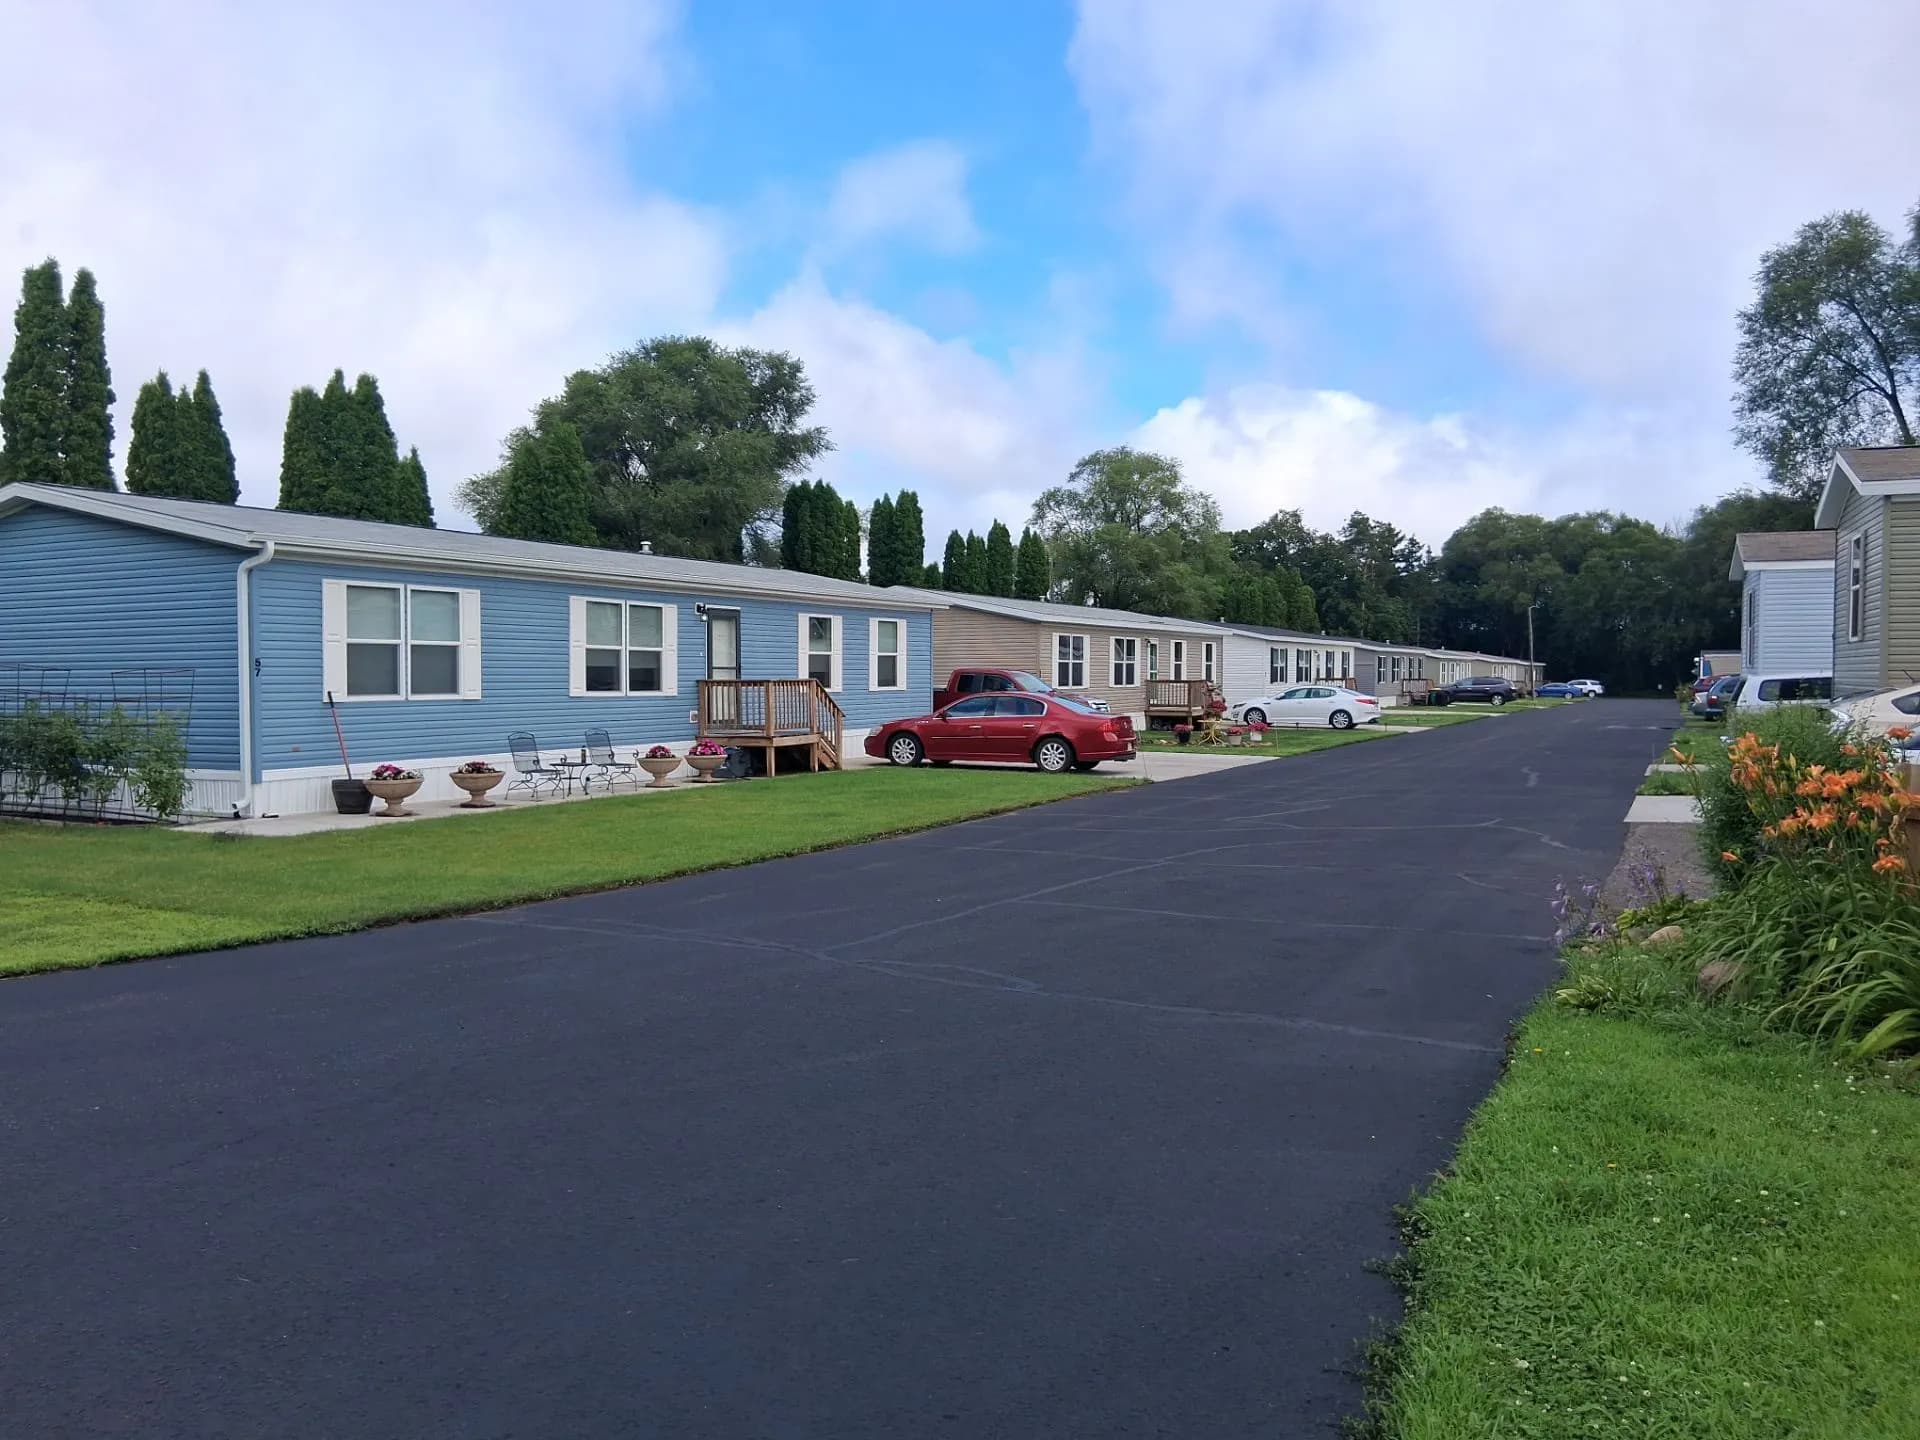
- FHFA data shows manufactured homes on owned land appreciated 219.1% since 2000 — site-built homes, 219.9%.
- The driver is land: 57.4% of U.S. home value in 2023, with land prices up +261% vs +49% for structures since 2012.
- The finding excludes land-lease communities — where the community owner, not the resident, holds the appreciating land. That's the side Elevation owns.
- Operators report 98.1% occupancy and ~21-year tenure; the 2026 ROAD to Housing Act is now law, while zoning still limits new supply.
For most of the last fifty years, manufactured housing carried a label it couldn't shake: the home that loses value. That label is now colliding with federal data.
The Federal Housing Finance Agency — the regulator that oversees Fannie Mae and Freddie Mac — publishes a dedicated price index for manufactured homes titled as real property. Through mid-2025, it shows manufactured homes appreciating essentially in lockstep with site-built houses for a quarter century. Institutional recognition, in other words, is finally arriving.
But most of the commentary stops at the headline, and the headline isn't the insight. Look one layer down and the appreciation story everyone's citing isn't really about houses at all. It's about land. That distinction is the foundation of how we've invested for more than two decades.
What the federal data actually says
From the first quarter of 2000 through the second quarter of 2025, manufactured homes in the FHFA index appreciated 219.1 percent. Site-built homes over the same window: 219.9 percent — roughly 5 percent a year for both, and a cumulative gap of less than one percentage point. The Urban Institute, which analyzed the index, adds that manufactured homes posted higher year-over-year gains than site-built homes in nearly every quarter of the past decade.
A quarter century of parity
Cumulative price appreciation, Q1 2000 – Q2 2025
Honest scoping matters here, so let's be precise about what this index measures. It tracks a specific slice of the market: homes titled as real property, sitting on land the homeowner owns, financed with mortgages backed by Fannie Mae and Freddie Mac — a small share of all manufactured-home lending — and concentrated in states like Texas, North Carolina, and Florida. For homes on land the borrower doesn't own, the Urban Institute is blunt: that value has “likely not performed nearly as well.”
Why would a factory-built house on owned land appreciate like a site-built one? Because in both cases, the engine isn't the building. American Enterprise Institute data cited by the Urban Institute shows land climbing from 35.7 percent of total home value in 2012 to 57.4 percent by 2023. Over that stretch, land prices rose 261 percent; structures rose just 49 percent. Structures are improvements — they age, wear out, and get rebuilt. Land is the scarce input.
The appreciation is a land story
U.S. home value decomposition, 2012–2023
Price growth, 2012–2023
Land's share of total home value
Why that's our thesis, not a footnote
In a land-lease community, ownership splits cleanly. The resident owns the home. The community owner owns everything underneath and around it — the land, the streets, the utility infrastructure, the amenities — and leases each site to the homeowner.
Read the federal data against that structure and the conclusion is hard to miss: the durable value in manufactured housing sits in exactly the part of the asset the community owner holds. That's the side of the equation Elevation has owned since 2003 — today, 70+ properties across 20+ states.
And because precision protects credibility, let's say the quiet part clearly: this research is not a claim that homes sited in our communities appreciate like site-built houses. The FHFA index measures homes on land the homeowner owns — a different arrangement from a land-lease community. A resident's home is housing, not an investment vehicle. What the resident gets is the most affordable path to homeownership in the country: the average new manufactured home sold for about $124,800 in 2024, versus roughly $424,176 for a new site-built home excluding land, per Census Bureau survey data cited by the Urban Institute. What the community owner holds is the scarce, income-producing land beneath an essential form of housing.
Who owns what in a land-lease community
The ownership split is the investment thesis
It's also why community owners weighing an exit talk to us about continuity — we welcome a conversation about potential fit, including 721 and 1031 exchange pathways.
The operating data backs the model
If the land thesis is right, you'd expect the owners of well-run communities to show durable occupancy, long resident tenure, and steady rent growth — and that's what the public markets reported this cycle. Per Skyview Advisors' Q4 2025 industry report, Sun Communities posted 98.1 percent same-property manufactured housing occupancy with full-year same-property NOI growth of 8.9 percent; UMH Properties grew site rents 7.6 percent year over year. Sun's average resident stays roughly 21 years (Skyview, Q1 2025). UMH runs a different, rental-weighted model — about 11,000 company-owned rental homes at 93.8 percent occupancy — which is why its blended occupancy reads lower than pure land-lease peers.
98.1%
Sun Communities same-property MH occupancy, Q4 2025
~21 yrs
Average resident tenure, Sun Communities
+8.9%
Sun Communities full-year same-property NOI growth, 2025
Source: Skyview Advisors, Q4 2025 and Q1 2025 Manufactured Housing Industry Reports. Historical data. Past performance does not guarantee future results.
The honest headwind: operating costs. UMH reported community operating expenses up roughly 10 percent year over year — driven by payroll, real estate taxes, utilities, and, notably, rising insurance premiums. Durable demand doesn't make a portfolio immune to expense pressure; it determines whether the model absorbs it. Meanwhile, the supply side barely moves — zoning keeps new community development scarce, which supports the value of the communities that already exist.
Washington moved from hearings to law
The policy groundwork was laid over a year ago. In May 2025, Cavco Industries CEO Bill Boor — testifying before a House Financial Services subcommittee as chairman of the Manufactured Housing Institute — made the industry's case for treating factory-built homes as core housing supply, including removing the statutory requirement that every manufactured home sit on a permanent steel chassis.
In 2026, that agenda became law. The 21st Century ROAD to Housing Act passed the Senate 85–5 and the House 358–32 in June, and was enacted on July 11, 2026. Among its provisions: the permanent-chassis requirement is eliminated, and HUD takes primary authority over manufactured-home energy standards. When was the last time a housing bill moved through Congress with margins like that?
One thing the law does not do is override local control: it directs HUD to publish guidelines for state and local policymakers, but zoning decisions stay local. For new manufactured-home supply, zoning remains the binding constraint — which is precisely why existing, well-located communities carry scarcity value. The tailwind helps the sector's legitimacy and the flow of homes; it doesn't flood the market with new communities.
The data is catching up to the thesis
We didn't build our strategy on this research — we've been acquiring and operating manufactured housing communities since 2003, on the conviction that affordable-housing demand is essential and the land under it is scarce. What's changed is that the federal government now publishes the data, and Congress now writes the law, that describe the same reality.
If you want to pressure-test the thesis, the numbers are the right place to start — our research hub covers 25 consecutive years of positive MHC sector NOI growth, performance through two recessions, and long-term return context for manufactured housing and self-storage.* We'd rather show you the data than make you a pitch.
*Historical data. Past performance does not guarantee future results.
Go deeper on the data
Explore the interactive research hub or download the white paper — historical MHC NOI growth, recession performance, and long-term return context.
Real people, real answers
Prefer to talk it through?
Investors get direct access to the team behind the communities — call or email and we'll walk you through the data.
Share this
Sources
- Urban Institute — Manufactured Homes Increase in Value at the Same Pace as Site-Built Homes
- Urban Institute / Housing Matters — How Can Manufactured Housing Address the Affordable Housing Crisis?
- FHFA Home Price Index, Q2 2025 (manufactured housing series)
- Congress.gov — Written testimony of Bill Boor, House Financial Services Subcommittee on Housing and Insurance, May 14, 2025
- NLIHC — Summary of the May 14, 2025 hearing on housing supply and innovation
- Bipartisan Policy Center — Inside the Deal: What's in the Final 21st Century ROAD to Housing Act
- Skyview Advisors — Q4 2025 Manufactured Housing Industry Report
- Skyview Advisors — Q1 2025 Manufactured Housing Industry Report
Educational commentary. This article is provided for informational and educational purposes only. It is not an offer to sell, or a solicitation of an offer to buy, any security, and it is not investment, tax, or legal advice. Historical figures — including sector appreciation, occupancy, NOI growth, and Elevation's own track record — are historical data; past performance does not guarantee future results. All real estate investments involve risk, including possible loss of principal.
For comprehensive disclosures regarding past performance, forward-looking statements, investment risks, and accredited investor requirements, please see our disclosures section in the footer.